|
|
|
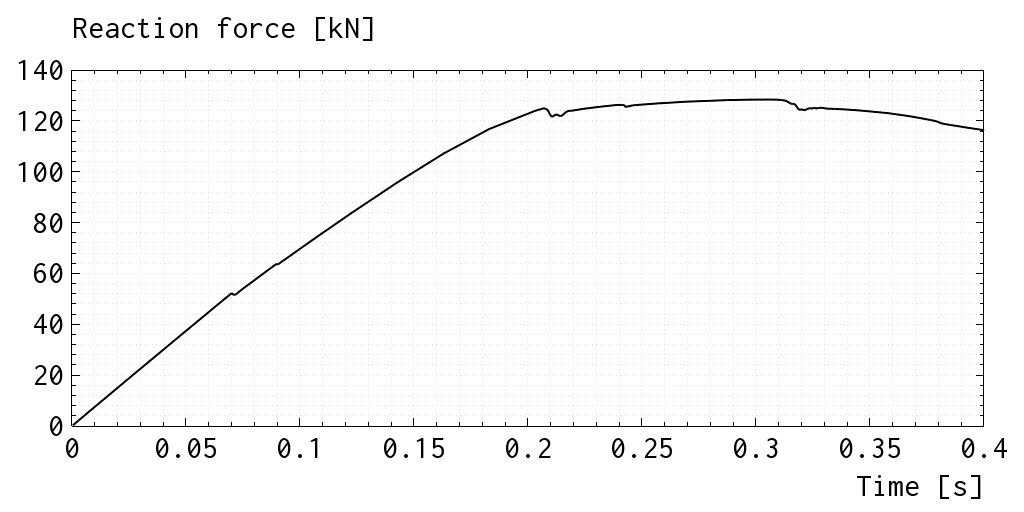
The History XY Plot tool is an extension to baspl++ offering a set of standard computational mechanics xy data extraction and graph visualization, such as graphs displaying non-linear solid mechanics behaviour. The History XY Plot tool is targeted at supporting B2000++ model databases, and It can be operated interactively or with scripts, which can be generated automatically from interactive sessions. The History XY Plot tool works seamlessly with all other baspl++ viewing functions. An example of a typical non-linear solid mechanics load history plot is given below.
The History XY Plot tool is based on a B2000++ specific data extraction, creating pairs of (x, y) values to be rendered with the baspl++ Graph and Curve classes. Data extraction functions of the x- and y-columns of data currently include
The extraction functions can be applied to the x- or to the y-axis (columns). An example of a typical non-linear solid mechanics load history plot is given below, where the data extraction function for the x-axis is the attribute TIME, and for the y-axis the sum of the forces induced by the compression of a cylindrical composite panel.
Published 2014-12-14