|
|
|
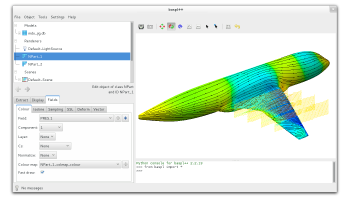
baspl++ is a viewer and post-processing framework for finite element and finite volume analysis results. It is specifically designed for multi-physics applications involving B2000++ FE models and unstructured and structured multi-block CFD models. Models can be viewed during simulation runs, and simultaneous visualization of several models is supported.
Please refer to Distribution for information on available platforms, and computer system requirements.
Several, powerful methods for the visualization of results from Euler and Reynolds-Averaged Navier-Stokes (RANS) simulations are available.
Surface streamlines are used to visualize the skin friction field in RANS simulations or any first-order tensor field that is defined on a surface, be it the skin, a cut through the volume, or an iso-surface. The placement of the seeding points and detection of the streamline endpoints is fully automatic and optimized to give visually pleasing results.
3D particle traces help to understand the flow field (steady and unsteady). A set of emitter grids can be positioned interactively or via the scripting interface.
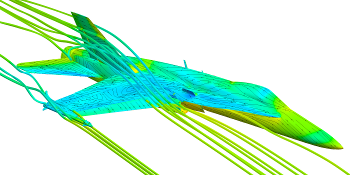 Mesh and analysis
by CFS Engineering
Mesh and analysis
by CFS Engineering
Several cutting planes can be defined. The cut can be restricted to the skin or other subsets of the model. Like for the iso-surface extraction method, any field variable can be visualized on the extracted surfaces.
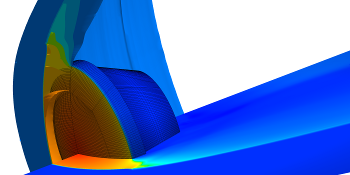 Mesh and analysis by EPFL
Any extraction can be restricted to a rectangular box and to a range of values of a field variable.
An extension to baspl++ to create typical CFD graphs, such as 'Profile' plots, 'Line' plots, and integrated aerodynamic coefficients plots. The CFD XY plot tools can handle structured multi-block finite volume grids and unstructured multi-block finite element grids. The CFD XY plot tools can be operated interactively or with scripts, and scripts can be generated automatically from sessions. CFDtools works seamlessly with all other baspl++ viewing functions.
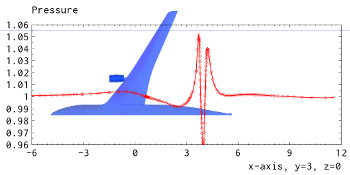 One-dimensional probe along straight line
baspl++ is controlled with a full-featured graphical user interface (GUI) and with an easy-to-use and flexible Python scripting interface. Scripting accelerates repetitive tasks and allows for customization. Productivity is further enhanced by the tight integration between the GUI and the Python interface:
The NSMB (Navier-Stokes Multi-Block) flow solver is fully supported. The coordinates can be displaced to the cell centers, useful for displaying graded colours and iso-lines. The boundary (skin, far field, etc.) can be extracted according to a range of boundary codes. And the so-called ijk-extraction permits the extraction of (topological) planes which is useful for manual inspection of block-structured grids.
baspl++ performs all visualization and post-processing tasks for FE analyses with B2000++. Some of the B2000++-specific capabilities are:
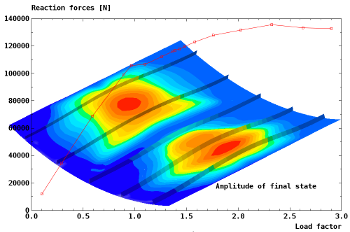 Postbuckling analysis of a composite panel
with B2000++
Postbuckling analysis of a composite panel
with B2000++
baspl++ is compatible with B2000++ and with the NSMB flow solver. It imports Tecplot ® data files and NASTRAN Bulk Data Deck files, DLR TAU files, and Edge files.