5. Coupled Problems
5.1. Loosely Coupled Thermomechanical Problems
5.1.1. Thermal Bending of Solid Model
Folder: $B2VERIFICATION/coupled/thermomechenical/cantilever
A two-dimensional solid model of a beam of length L=1m, height H=0.05m, and thickness t=0.01m is clamped on the left side x=0 and subject to differential temperature distribution. The beam is modeled by quadratic 2D solid elements (Q8). This simple case produces deformations but no stresses. The analysis is performed on a common mesh in 2 steps:
Heat analysis: Calculate temperatures at mesh nodes. Prescribed temperatures at the top are T=50 and at the bottom T=-50.
Deformation analysis: With temperatures from above step, calculate deformations and stresses.
The heat analysis mesh and boundary conditions are displayed below, the
input being described in the MDL input file heat.mdl:
The same mesh is used for the thermally induced deformation analysis,
see MDL input file deform.mdl. With temperatures imported from the
heat analysis database (see temperatures command in deform.mdl)
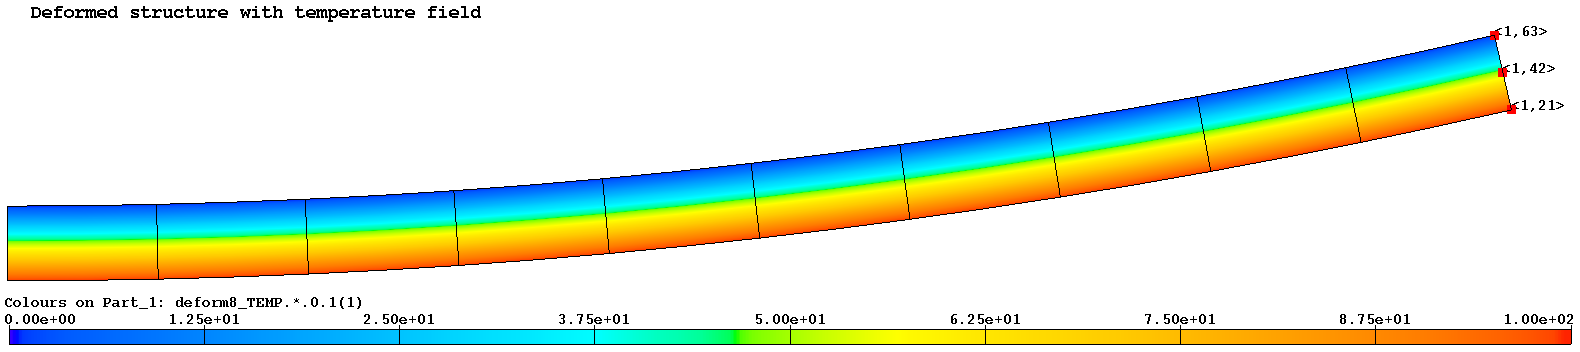
the linear static deformation analysis computes the deformations. The
figure below displays the deformed structure and the temperatures
inducing such a deformation (color contours), the red dots designating
nodes for which the comparison with the analytical solution is made:
A simple analytical solution for the deformation of a clamped beam subject to a uniform temperature variation from top to bottom can be found in [Roark]. The maximum tip deflection at x=L is
with the thermal expansion coefficient \(alpha\), the temperature difference \({\Delta}T\), the length of the beam \(L\), and the beam thickness \(t\).
To execute the test, run the shell script run.sh or launch
b2testrunner -t test .
The deformed mesh due to differential temperature distribution is shown below:
To view the results, the temperatures have to be copied from the heat
analysis database to the deformation analysis database. This is only
necessary in case the temperatures are to be plotted in the same
database as the deformations for viewing combined temperatures and
deformations, as shown in the figure above. This can be done with the
Python script cpheat.py:
python
  cpheat.py
5.1.2. Thermal Stresses in Clamped Beam
Folder: $B2VERIFICATION/coupled/thermomechenical/clampedbeam
A two-dimensional solid model of a beam of length L=1m, height H=0.05m, and thickness t=0.01m is clamped on both sides and subject to differential temperature distribution. The structure is modeled by quadratic 2D solid elements (Q8 and Q9), the model being the same as the clamped beam example, with the difference that the beam is clamped on both sides, producing stresses but no deformations. The analysis is performed on a common mesh in 2 steps:
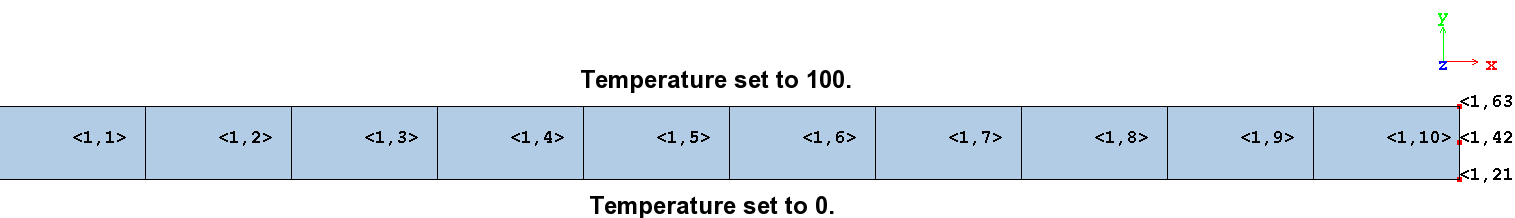
Heat analysis: Calculate temperatures at mesh nodes. Prescribed temperatures at the top are T=100 and at the bottom T=-100.
Deformation analysis: With temperatures from above step, calculate deformations and stresses.
A simple analytical solution for the maximum longitudinal stress \(\sigma_{xx}\) of a clamped beam subject to a uniform temperature variation T at the top to -T at the bottom can be found in [Roark]:
where \({\alpha}\) is the thermal expansion coefficient, \({T}\) the temperature, \({E}\) Young’s modulus, \({J}\) the area moment, and \({h}\) the beam height. The figure below displays discrete values of \(\sigma_{xx}\) at the Gauss or ‘sampling’ points, the temperature being the same as in the previous example.
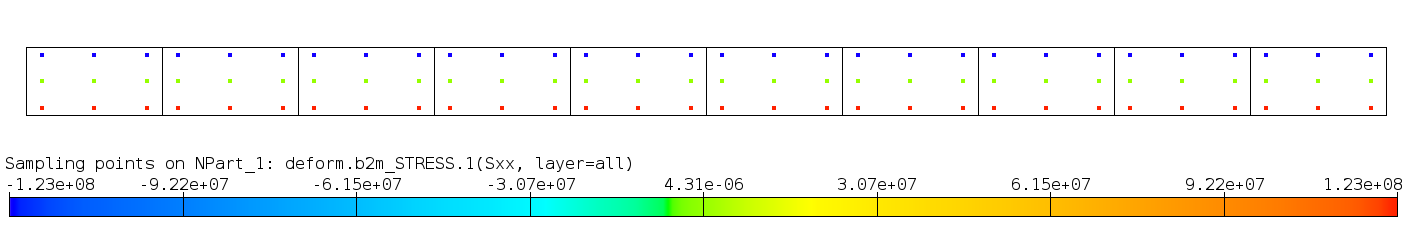
Stresses at Gauss points: Values at +-0.7746 half height of beam (blue and red dots).